
Jesse Van Mouwerik

Pacific Ag · Value Chain · 2026

Optimizing an agricultural supply chain with AI

Role
Product, design and build, from zero to a live pilot
Users
Internal employees at Pacific Ag, in accounting, sales and management
Methods
Interviews, screen walkthroughs, a PRD, building with Claude Code
Outcome
The pilot won the contract for the full tool

Crop residue, from the field to the people who can use it.

Pacific Ag, founded in 1998 in Hermiston, Oregon, collects crop residue like wheat and grass straw after harvest. It sells it as feed, compost and bio-based material to dairies, feedlots, mushroom farms and fiber businesses, across the Pacific Northwest and to export markets such as Japan and Korea.
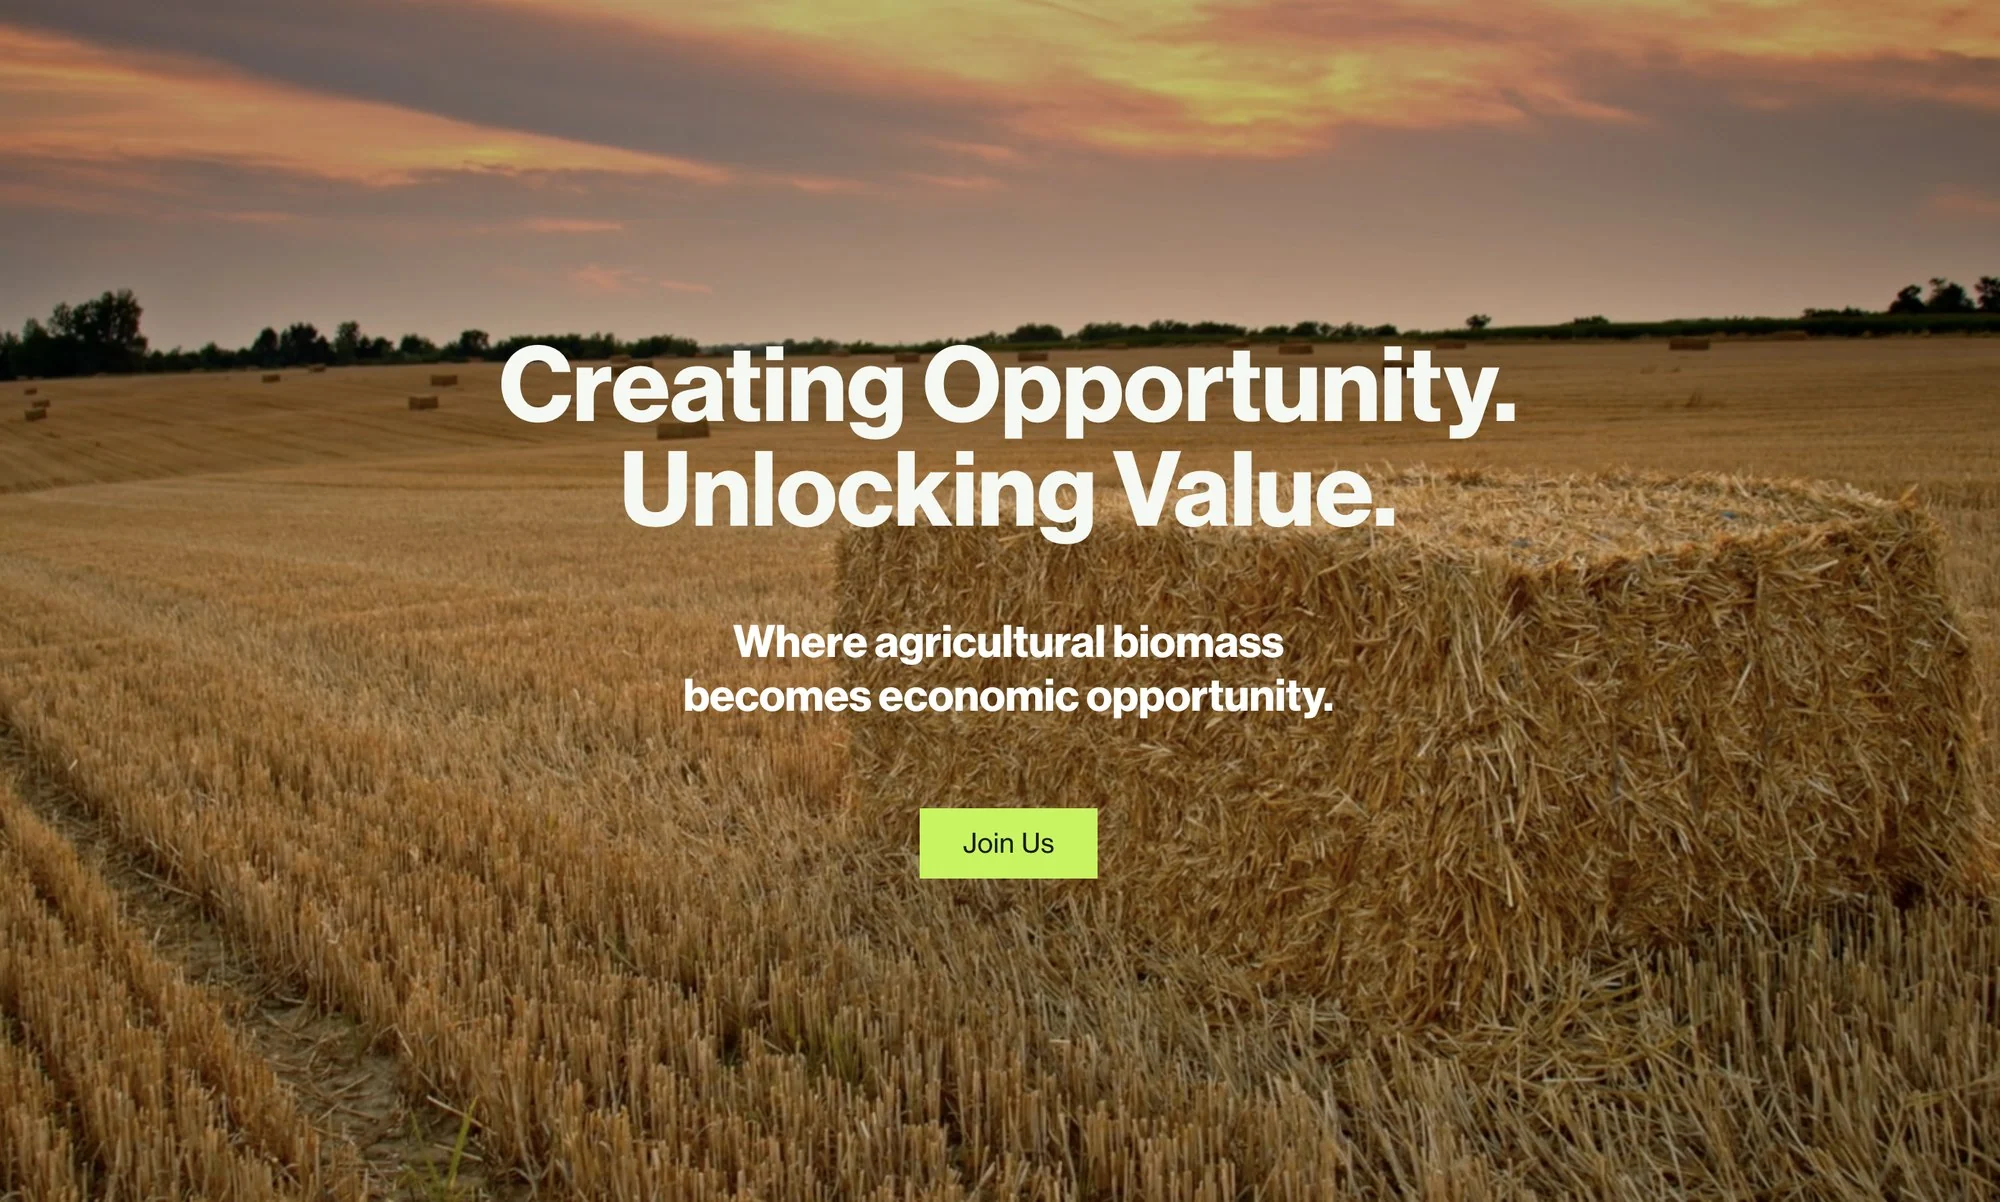
Pacific Ag’s website: a large straw bale in a harvested field at sunset, under the headline Creating Opportunity. Unlocking Value. Where agricultural biomass becomes economic opportunity.
Where it starts: straw baled on the field after harvest. Image: Pacific Ag’s website.

Many growers, many fields, many customers.

Grower’s fieldSmall balesGrower’s fieldBig balesGrower’s fieldMixed balesWarehouseStored for laterDairyFeedMushroom farmCompostExport buyerJapan, KoreaBiodigesterPackagingGROWERS’ FIELDS, BALEDSOMETIMES STOREDCUSTOMERS

Many growers’ fields, baled after harvest into bales of different sizes. The bales go straight to customers, or first to a warehouse, stored for later, and then on to customers: dairies, mushroom farms, export buyers and biodigesters.

Every leg ships one of two waysIn-house trucksA trucking contractor

The puzzle: for every load, find the best mix of pickup date, storage, route and price, while fuel and the cost of pulling bales off a field keep changing. Value Chain, an internal tool for Pacific Ag’s own team, saves time on that calculation, then uses the logged data to make the whole chain more efficient.

01

Problem

Every quote waited on one person.

Every quote went through one person, a manager. They found the stack on a map, measured miles in Google Maps, read a rate off a mileage sheet, added fuel and fees, and filled in a signed form for Finance. Sales couldn’t price a deal without them, so growers and customers waited.

Quotes the team trusts, at the speed sales needs.

Outcome for the user The manager hands routine pricing to a tool they trust, sales can quote prospective customers within set limits, and finance signs off in the same place.
Product output A per-ton quote tool built on the company’s own rules, with both sign-offs inside it.
Outcome for the business Faster quotes, protected margin on every load, and better EBITDA.

Value Chain: quotes built on Pacific Ag’s own rules.

Value Chain is an internal tool, used only by Pacific Ag’s own team, not by growers or customers. A quote now starts as a full draft. Enter the request and pick the stacks, and a pricing engine applies Pacific Ag’s rules per ton. Both sign-offs happen in the same app: the manager approves freight, then finance approves the whole quote.

How the workflow changed.

Today The manual process: 5 tools and 2 emails, every figure typed twice.
  1. Find the stack Map
  2. Measure miles Google Maps
  3. Find the rate band Rate sheet
  4. Add fuel Fuel table
  5. Check past lanes Spreadsheet
  6. Fill in and sign the form PDF
  7. Finance signs Email
  8. Accounting books it ERP

Where it hurt: miles looked up on every quote, diesel always moving, repeat deals priced at last year’s rate, and sales unable to quote alone.

Pilot, live now One app, with both sign-offs inside it.
  1. Load the rate sheet
  2. Enter the request
  3. Pick stacks Many to many
  4. Draft the quote Pricing engine
  5. Manager approves freight
  6. Finance approves
  7. Quote history

Still open: miles typed by hand, no fuel surcharge yet, and nothing reaches accounting yet.

Next, the full tool From request to booked sale, with margin review after.
  1. Enter the request Sales or pricing
  2. Route the miles Automatic
  3. Freight with fuel Today’s diesel
  4. Check the lane Past rates
  5. Manager approves freight
  6. Finance approves
  7. Send to accounting Signed PDF
  8. Accounting books it ERP
  9. Review margin Planned vs. actual

What it adds: big mileage gaps flagged, old-rate repeat deals caught, and every quote saved with its PDF.

New in the tool Finance Accounting Later phase

Designed around the yard, not the spreadsheet.

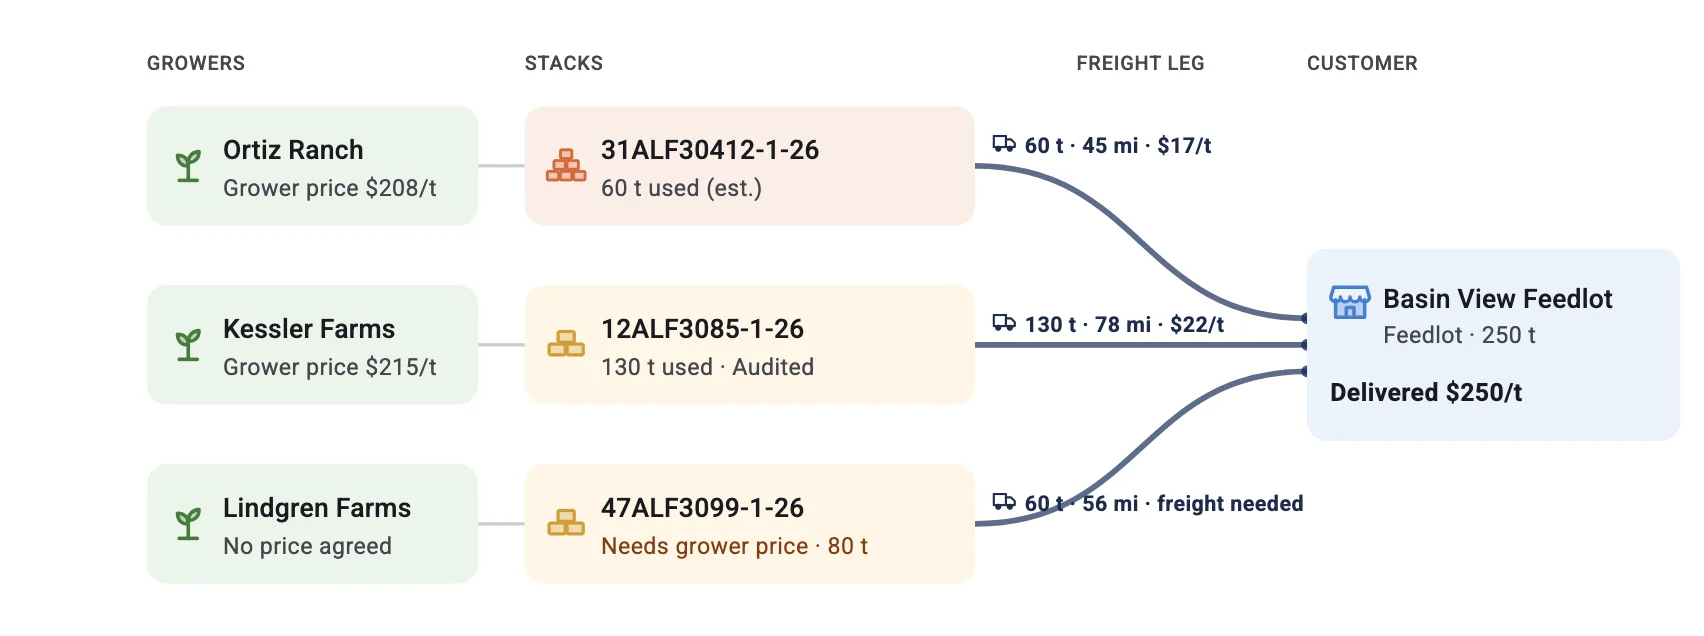
The app speaks Pacific Ag’s language: growers, stacks, freight legs and customers, each with its own color and icon. All names and figures in these screens are sample data.

Many stacks, one customer, one view Each freight leg shows its tons, road miles and rate. A stack with no agreed grower price is marked, not hidden.
A route diagram with sample data: three growers, each linked to a bale stack, with three freight legs running to one feedlot customer at a delivered price per ton. One stack is marked as needing a grower price, and its freight leg as freight needed.
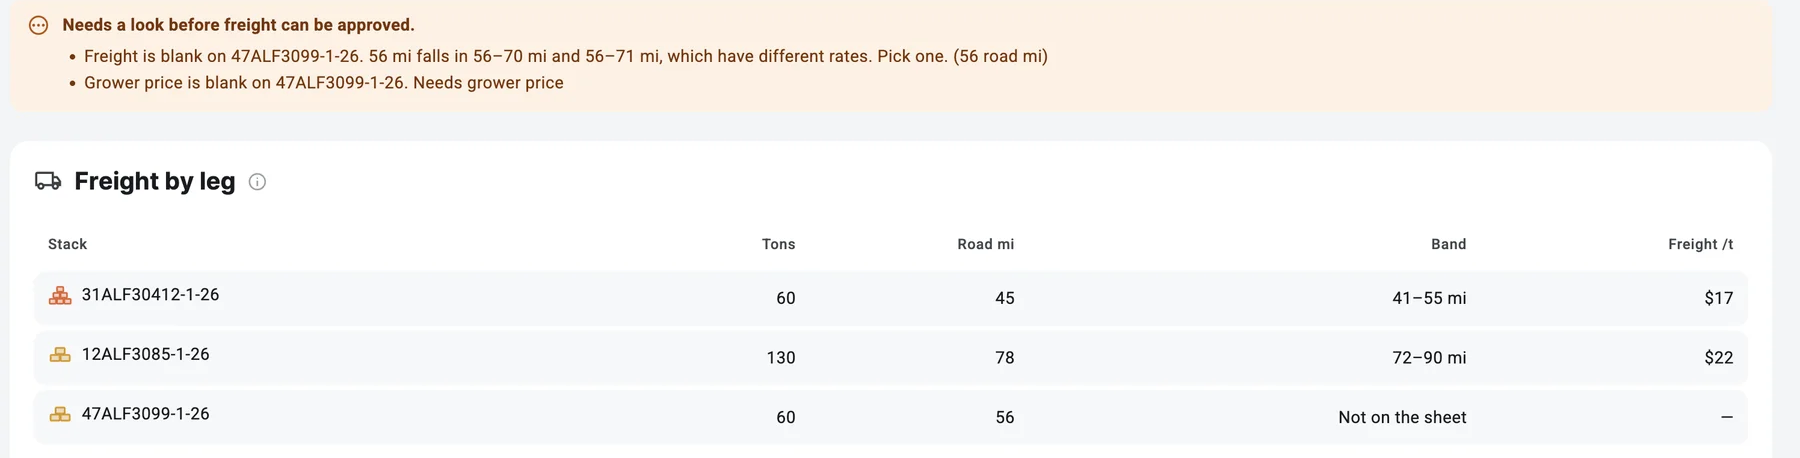
It flags instead of guessing When 56 miles fits two mileage bands, freight can’t be approved until a person picks one.
A needs-a-look warning above the freight table, with sample data: freight is blank on one stack because 56 miles falls in two mileage bands with different rates, and its grower price is blank. The freight-by-leg table lists each stack’s tons, road miles, band and freight per ton, with the flagged stack marked not on the sheet.
Judgment gets logged Every override carries a reason, like windy roads or backhaul. Those reasons are the raw material for finding where margin goes.
Override reason chips: dead head, windy roads, backhaul (selected), fuel and other, with apply and cancel buttons
04

Results

Outcome

Quotes now start as full drafts built from Pacific Ag’s own pricing rules, and the pilot won me the contract to build the full internal tool.

Contract won The pilot won the contract for the full internal tool
Live pilot In use inside Pacific Ag, with separate roles for pricing and finance
5 tools→1 app Five tools and two emails became one app, with both sign-offs inside it
Every override Logged with a reason, the raw data for margin review

Value Chain showed Pacific Ag that its most manual process could be systematized without losing the judgment of the person who built it. A quote that needed a map, a mileage lookup and a rate sheet now starts as a full draft. Sales has a path to price routine deals, including quotes for prospective customers, with only exceptions going to the manager.

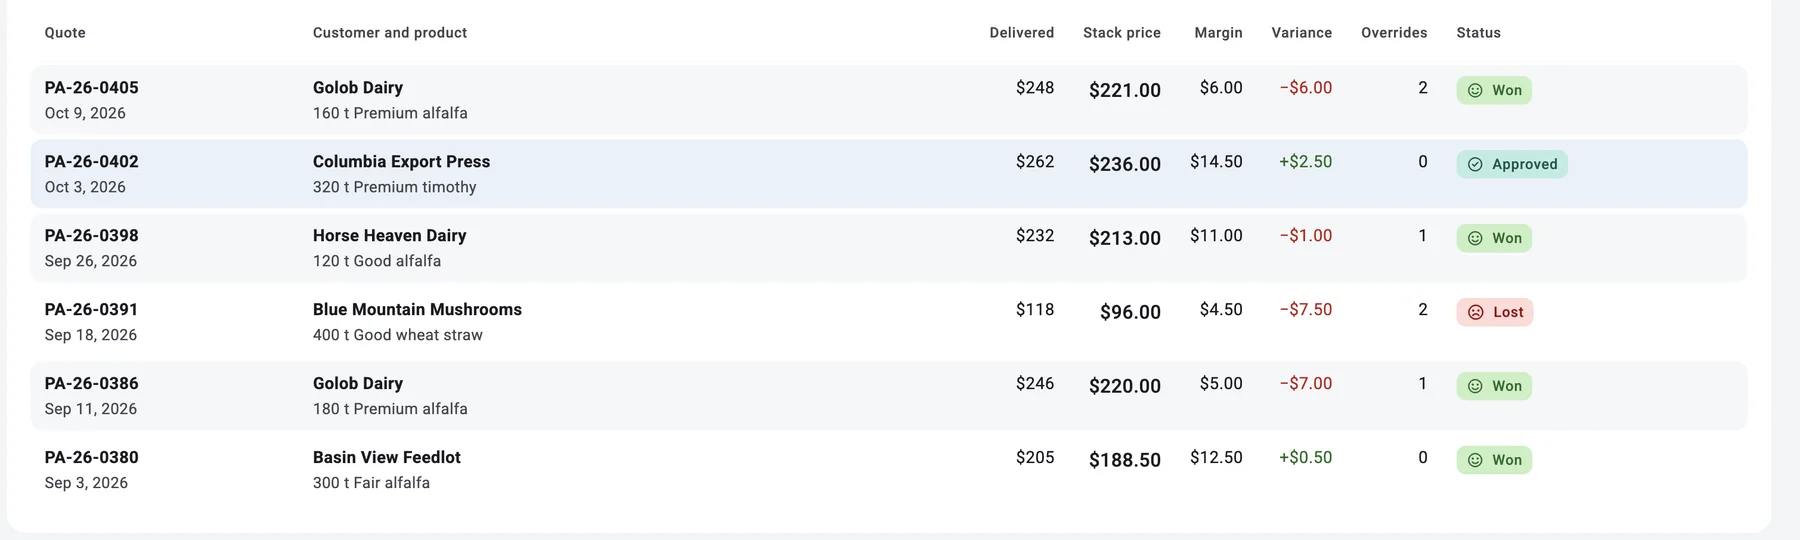
The quote history table with sample data: each quote’s number and date, customer and product, delivered price, stack price, margin, variance against budget, number of overrides, and a status such as won, lost, approved or draft
Quote history: every quote, margin and outcome in one place, with variance against budget next to won or lost, so patterns start to show. All figures are sample data.

Every quote, override and reason is logged, which is the data the next phase needs. The interviews also surfaced gaps the old process hid, such as fuel surcharges and truck type.

The point was never to replace anyone. Capturing the manager’s judgment frees them from routine quotes to do higher-value work: reviewing margin and improving the chain.

05

Process

The research, decisions and steps behind the result.

More projects